What will you use HousingWeaver for?
We designed HousingWeaver to serve communities large and small, with data available for almost every city, town, county, township, metro, and state in the United States.
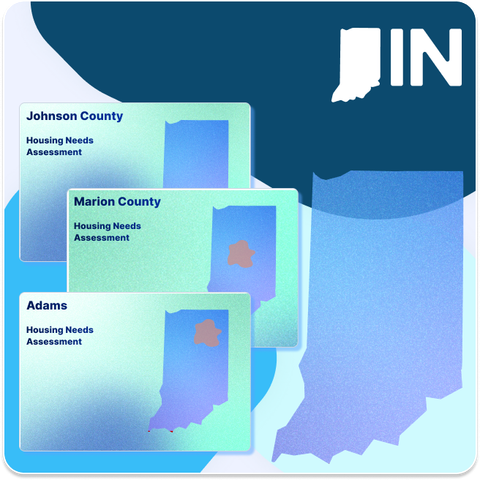
The State of Indiana provides housing needs assessments to all of their counties and cities that are always up to date and available.

Identify your community's housing needs on-demand, including a deep dive on your housing market and its context across your county, metro, or state.
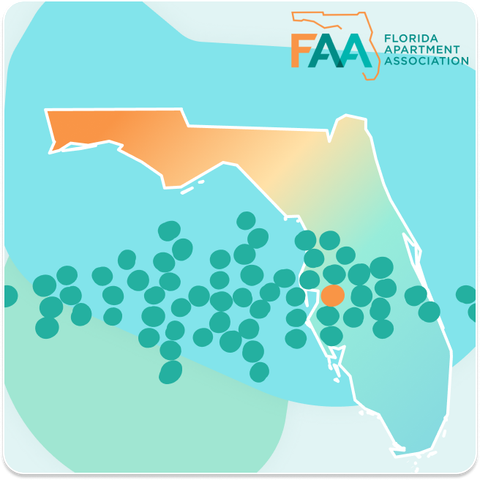
The Florida Apartment Association advocates for housing abundance across the state with the Build Florida 2030 initiative.

Create community-ready dashboards and narratives that clearly articulate the benefits of new housing opportunities across your community.
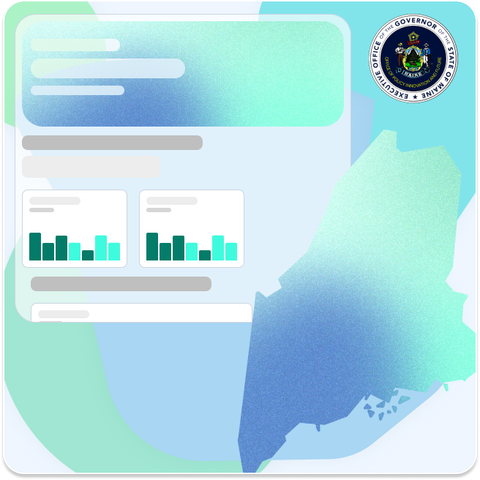
Maine's Governor's Office designed the state's first production targets and are now tracking progress across it's three economic zones.

Track policy impacts and progress toward goals over time and circulate progress reports to stakeholders.
The City of Austin evaluated sites for affordable housing across the city based on the state's LIHTC scoring system.

Leverage parcel-level analysis tailored to your city and your state’s QAP. Compare location-based scores across your portfolio.
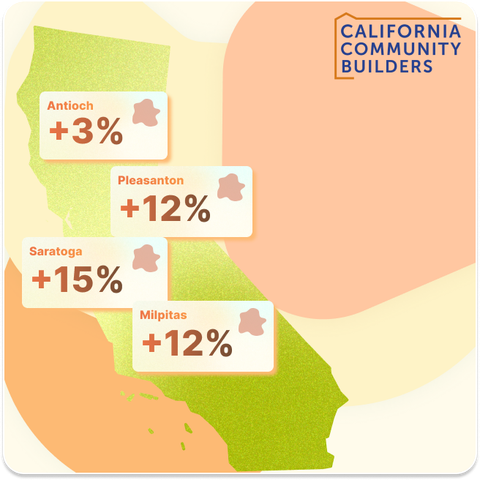
The California Community Builders studied the potential of single-family zoning reform across California.

Trying to understand if a new housing policy will help move the needle? Access a suite of tools to understand the impacts of housing policies based on your market dynamics.
The Michigan Municipal League developed the tools that their constituents needed to codesign housing plans.

Work with advocates, residents, elected officials, and government agencies using robust data and the policy tools that are right for your community.
Codesign Housing Plans
Indiana Housing Dashboard
The Indiana Housing and Community Development Authority (IHCDA) partnered with HousingWeaver to conduct a comprehensive statewide housing study. Utilizing HousingWeaver's extensive data library, we integrated local housing inventory data with state-level market trends for all Indiana counties.
HousingWeaver's powerful analytics and visualization tools enabled the creation of the Indiana Housing Dashboard, an interactive web-based platform presenting complex data in an accessible format. The dashboard leverages our Snapshot, Comparison, and Map Views, allowing users to explore housing trends at various geographic levels.
HousingWeaver's flexibility allowed for easy updates and modifications, supporting IHCDA's ongoing efforts to refine and expand the dashboard with more granular data and additional housing planning resources for local practitioners.

Evaluate sites for affordable housing
Austin QAP Location Score Analysis
The City of Austin partnered with HousingWeaver to develop a Qualified Allocation Plan (QAP) tool for evaluating parcels across the city. Leveraging our extensive data library and custom insights features, we integrated Austin's local zoning and land use data with our comprehensive datasets on demographics, transit accessibility, and economic indicators.
Using HousingWeaver's Map Views, planners could visualize high-scoring areas and identify optimal locations for affordable housing development.
This data-driven approach streamlined Austin's decision-making process for allocating Low-Income Housing Tax Credits, ensuring more strategic placement of affordable housing projects throughout the city.

Advocate for housing abundance
Build Florida 2030
We partnered with the Florida Apartment Association to create HousingWeaver Data Views and develop an advocacy tool for residents and policymakers to track rapidly growing housing needs at the county and metro-area levels.
In addition to assessing current housing needs across income brackets, the tool also displays the projected future housing supply gap, emphasizing the detrimental ongoing impacts—especially for lower-income renters—that statewide housing shortages will have if left unchecked. These findings were visualized using interactive heat maps and charts easily digestible to public stakeholders.
We update the tool annually, and it remains a vital source for state representatives, developers, and county officials when developing policy and advocating for more housing.

Set and Achieve Targets
Calculating Production Targets in Maine
HousingWeaver partnered with Maine's Governor's Office of Policy Innovation and the Future (GOPIF) to conduct a comprehensive analysis of housing needs and production gaps across the state.
Leveraging our robust data library and custom insights feature, we integrated Maine's demographic data, economic indicators, and short-term rental information to provide a nuanced view of housing dynamics. Using our advanced analytics tools, we projected future housing needs based on population growth forecasts for various household types.
HousingWeaver's Policy Calculators were instrumental in analyzing the impact of short-term rentals on workforce housing availability and costs in tourism-driven coastal markets. This marked the first time Maine set region-specific production targets.

Calculate Policy Impacts
Analyzing Upzoning Potential in the Bay Area
California Community Builders (CCB) partnered with HousingWeaver to study the potential effects of single-family zoning reform across California. This critical analysis came in the wake of multiple defeated housing bills and the exacerbating effects of the COVID-19 pandemic on the state's housing crisis.
Our custom insights feature allowed us to focus on how zoning reform could impact housing market behaviors, with particular attention to equity considerations between high- and low-income neighborhoods.
Using HousingWeaver's powerful Policy Calculator, we developed an econometric model to test the impact of a hypothetical zoning policy across various community types in the Bay Area. This model accounted for unique market dynamics within each community, providing nuanced insights into potential outcomes.


