Features
The analysis you need to understand your housing market
Explore interactively. Compare against peers. Model policies. Generate a complete needs assessment. One platform, 40+ data sources, always current.
Data views
Three ways to see your community's data
Each view is designed for a different workflow. Use them together or on their own.
Snapshot view
Your housing landscape at a glance. Interactive charts organized by topic: demographics, housing supply, affordability, homeownership, and renter needs. Each section surfaces key metrics with plain-language context explaining what the data means for your community. This is usually the first place people go.
Map view
See your data geographically at the tract level. Visualize where cost burdens concentrate, where production is happening, and where displacement risk is highest. Supports custom geographies so you can overlay your own boundaries.
Comparison view
How does your community stack up? Benchmark against your metro, neighboring jurisdictions, or statistically similar places across the country. Cycle through indicators to find where you lead, where you lag, and start asking why. Peer sets are pre-computed so you get meaningful comparisons out of the box.
Housing needs assessment
The report that used to take six months, generated in minutes
HousingWeaver's AI engine analyzes your community across six modules and produces a complete Housing Needs Assessment with narrative analysis, key findings, and peer context. The output reads like a consultant report: grounded in authoritative data, written in plain language, structured for the audiences you need to reach.
Population
Growth trends, demographic shifts, household formation, age distribution
Economy
Employment, wages, industry mix, commute patterns, income distribution
Housing stock
Units by type and age, vacancy, building permits, production pipeline
Housing costs
Rent levels, home values, cost trends, affordability gaps by income
Homeownership
Ownership rates, purchase affordability, mortgage access, equity trends
Renter needs
Cost burden, supply gaps by AMI, subsidized inventory, renter demographics
Executive summary
Every HNA comes with an executive summary that pulls the most important findings across all six modules into a single briefing. Key metrics, top takeaways, and a clear read on where your community stands. Designed for the people who need the headline, not the appendix.
Executive briefings
Need a version for elected officials or board members? Executive briefings distill the full HNA into a concise format with key findings, critical metrics, and recommended focus areas.
Data library
40+ data sources. 600+ indicators. Zero wrangling
We combine datasets, standardize geographies, and distill everything into the indicators that actually matter for housing decisions. Every indicator is documented, every source is cited, and everything updates as new releases come in.
Your local data, on the platform
Upload parcel records, permit data, local surveys, or administrative records and layer them alongside national data. Define custom geographies, build custom indicators, and blend national context with local detail. Your data stays private to your account.
Soft site analysis
Find the parcels with development potential
Screen every parcel in your jurisdiction for development or redevelopment suitability. HousingWeaver cross-references zoning, land use, lot size, and improvement-to-land value ratios to surface sites where new housing could go.
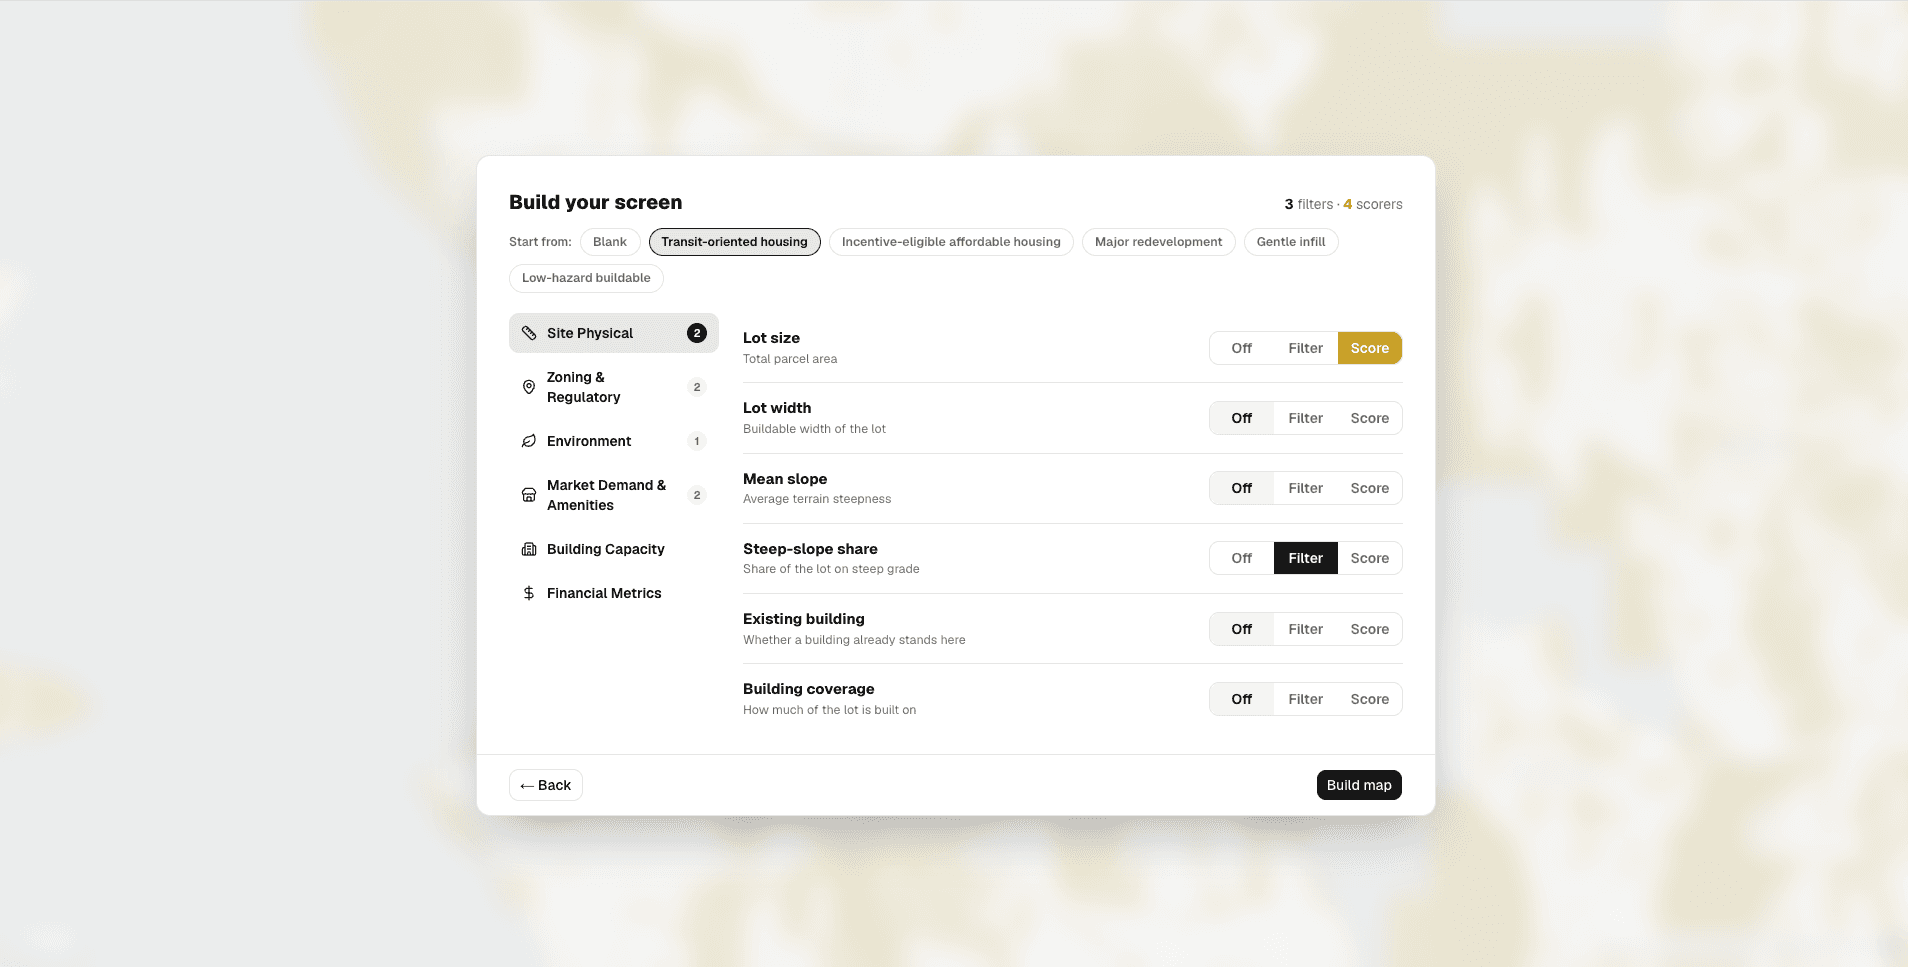
Screening layers built in
Every analysis includes national screening layers for FEMA floodplains, Opportunity Zones, New Markets Tax Credit eligible tracts, and proximity to amenities and transit. No need to assemble the data yourself.
Custom criteria
Add your own screening parameters. Filter by lot size minimums, exclude parcels in historic districts, prioritize sites near job centers or schools. Build the filter stack that matches your community's priorities.
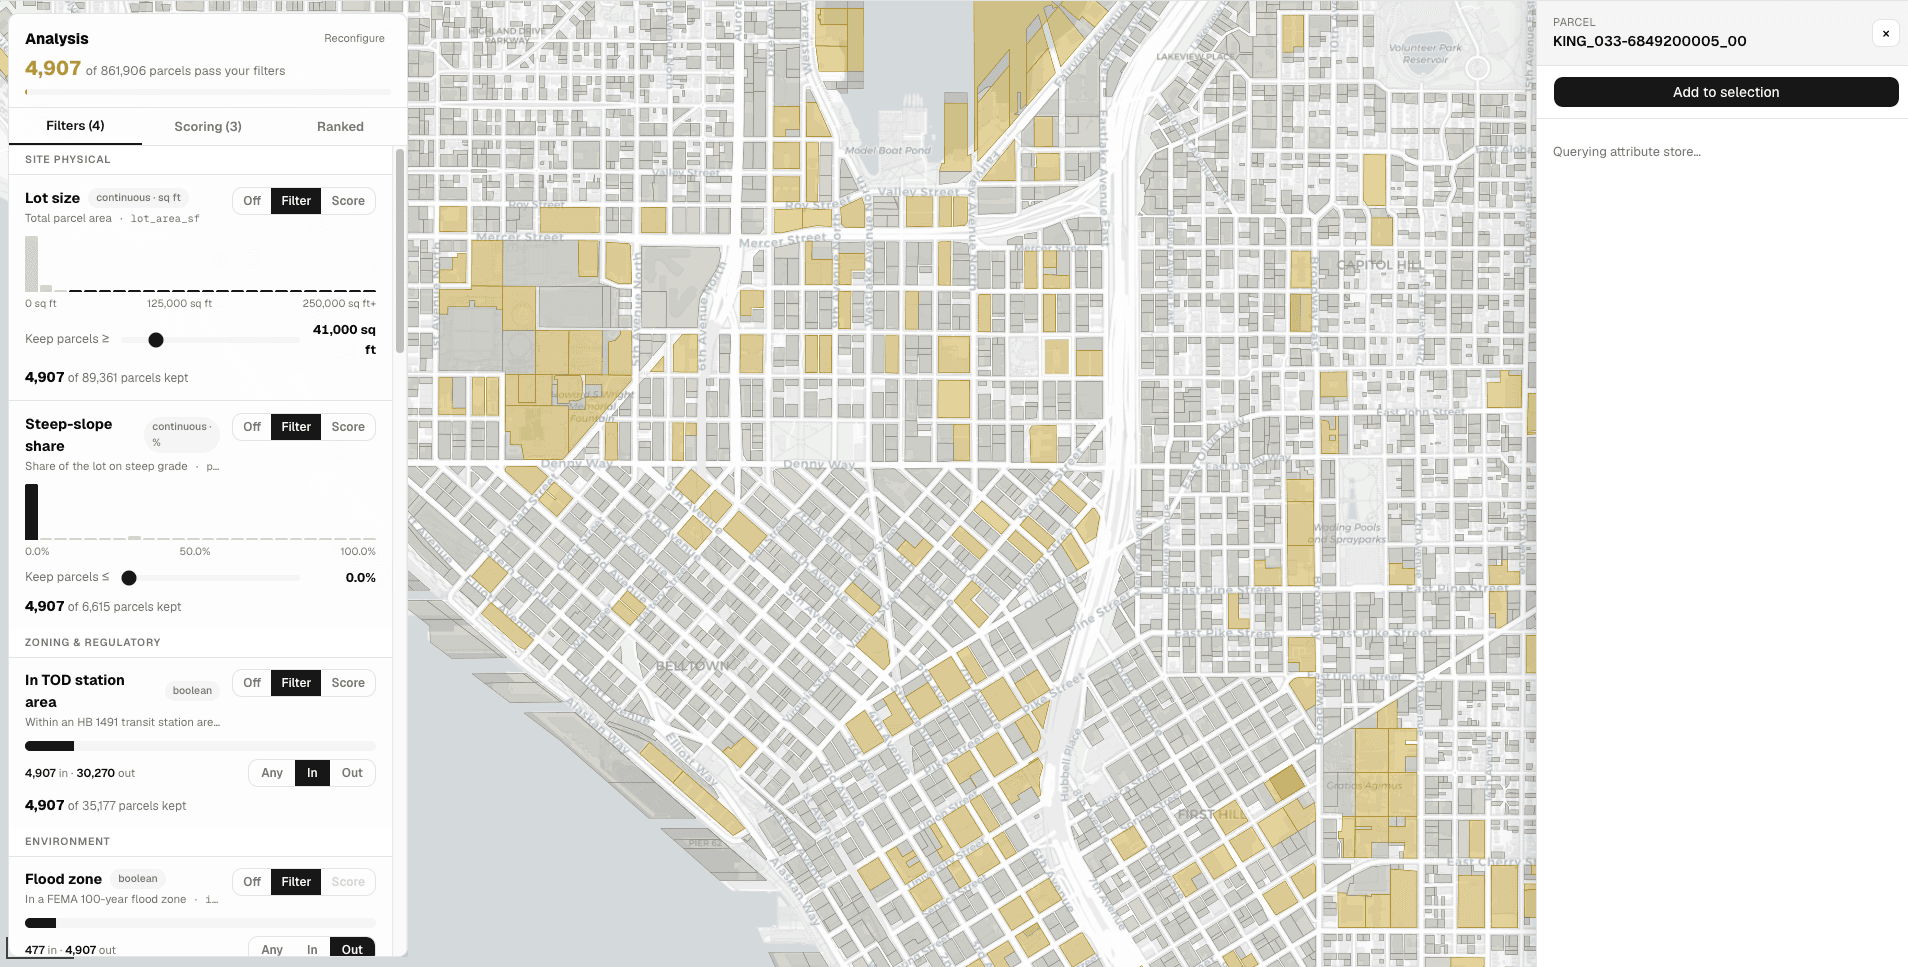
Parcel-level results
Output is a scored, filterable parcel inventory you can export, map, and bring to site selection conversations. Every parcel includes the underlying data so you can explain why it scored the way it did.
Used by
Housing departments evaluating sites for affordable housing development. State agencies scoring parcels for QAP and LIHTC allocation. Developers identifying opportunity in unfamiliar markets.
Housing demand forecasting
Project future housing demand. Set production targets grounded in data
How many units does your community need over the next 5, 10, or 20 years? HousingWeaver's forecasting tools project demand based on population growth, household formation, and demographic trends, then translate that into production targets by housing type and cost level.
Cohort-component projections
Population projections built from age-specific fertility, mortality, and migration rates. Not just trend lines — the demographic mechanics that drive housing demand.
Demand by type and cost
Translate population projections into housing unit needs segmented by tenure (rent vs. own), bedroom count, and affordability level. Access analysis on the types of homes your community needs by price and tenure, not just total units.
Production gap analysis
Compare projected demand against your current production pipeline. How many units are permitted? How many are under construction? Where are the gaps by type, cost level, and geography?
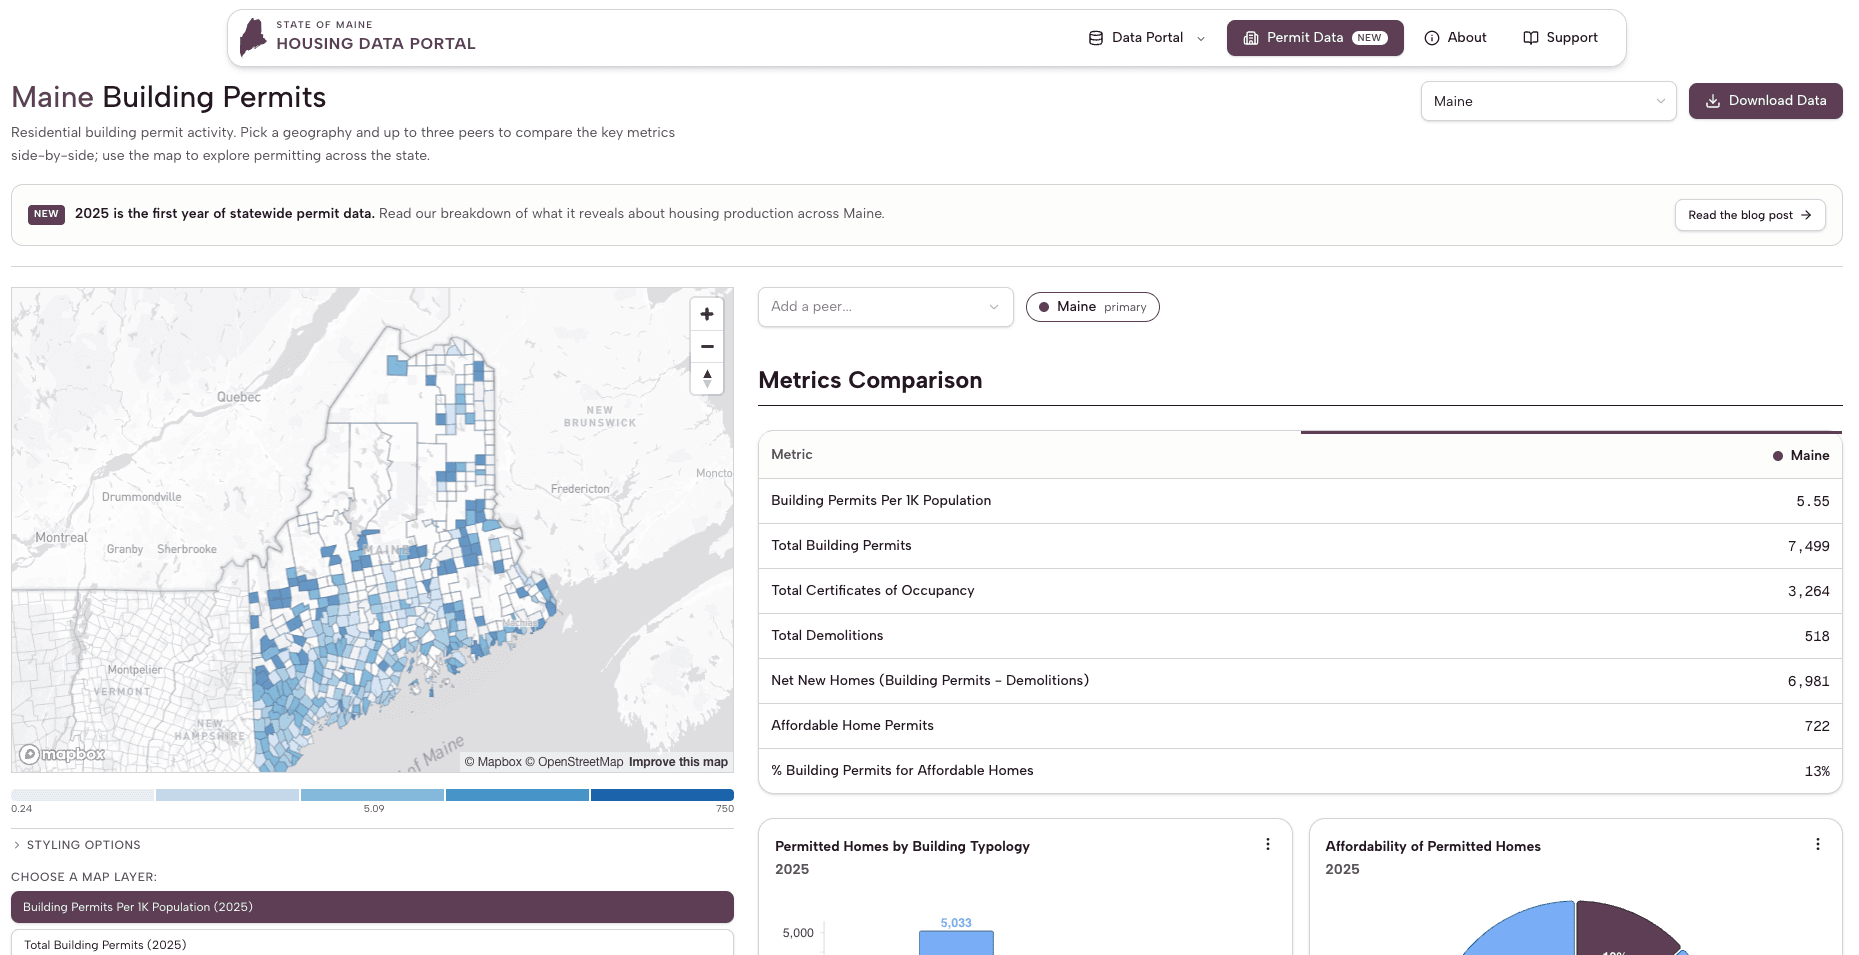
Target setting
Set region-specific production targets the way Maine did — grounded in data, defensible in public, and trackable over time.
Used by
State agencies setting statewide production targets. Regional planning bodies allocating housing growth across jurisdictions. Cities sizing the housing element of their comprehensive plan.
Displacement analysis
Identify communities at risk before displacement happens
Displacement risk mapping at the neighborhood level. Track the early indicators that signal when rising costs, changing demographics, and new investment put existing residents at risk of involuntary moves.
Risk indicators
Composite risk scores built from rent increases, demographic change, eviction trends, cost burden concentration, new investment activity, and loss of naturally occurring affordable housing.
Neighborhood-level mapping
See displacement risk at the tract level across your jurisdiction. Identify which neighborhoods are stable, which are at the tipping point, and which are already experiencing displacement.
Tracking over time
Monitor how risk scores change as new data comes in. Track whether interventions are working or whether conditions are worsening in the communities you're watching.
Based on mortgage data, households moving in make 4× as much as existing households in the neighborhood.
Used by
Housing departments developing anti-displacement strategies. Community organizations advocating for preservation funding. Elected officials directing resources to neighborhoods in transition.
Policy calculators
Model the impact before you vote
Run scenarios for major housing policy tools using models calibrated to your local market. See projected outcomes over five years — units created, affordability impacts, and production effects. Bring analysis to the table, not guesses.
Inclusionary zoning
Model mandatory or voluntary IZ programs at different set-aside percentages and AMI targets. See how many affordable units get produced and what the impact is on overall production.
ADU programs
Estimate ADU adoption rates under different regulatory scenarios. How many accessory units could your community add and at what rent levels?
Upzoning
Model the effects of zoning reform — from single-family to duplex/triplex/fourplex — on potential production, density, and affordability.
Rent stabilization
Project the impact of rent stabilization policies on rent levels, cost burden rates, and housing production.
Additional policy types available. Custom calculators can be built for Professional engagements.
Proforma tool
Understand what pencils out
Run development feasibility analysis for housing projects in your community. Model costs, revenues, financing structures, and subsidy requirements to see where the gaps are and what it takes to make a project work.
Market-calibrated inputs
Pre-populated with local construction costs, rent levels, operating expenses, and financing terms drawn from HousingWeaver's data library. Adjust any assumption to match your deal.
Subsidy gap analysis
See how much subsidy a project needs at different AMI targets. Compare financing scenarios side by side — LIHTC, bonds, HOME, local trust fund, or combinations.
Scenario comparison
Run multiple scenarios and compare them. What if construction costs increase 10%? What if you add a commercial ground floor? What if the AMI mix shifts? See how each change affects feasibility.
Used by
Housing finance agencies evaluating LIHTC applications. Developers testing project feasibility before committing to a site. Planning departments assessing whether proposed affordable housing targets are realistic.
Exports and sharing
Export-ready for stakeholders
Download charts, maps, and reports as branded PNGs, PDFs, and CSVs. Every export is formatted for council meetings, grant applications, public engagement, and stakeholder briefings.
Professional plans include white-labeled and custom-branded exports.
Community platform
Share housing data with your community
Give constituents, stakeholders, and partner organizations direct access to housing data through a branded, public-facing dashboard. Build trust through transparency, reduce repetitive data requests, and create a shared fact base for community conversations about housing. White-label ready.
Policy resource library
Best practices from communities across the country
A reference library of housing policy tools, implementation guides, and case examples. See what other communities have done with inclusionary zoning, ADU programs, community land trusts, tenant protections, and other strategies. Grounded in HR&A's 50 years of housing policy work.
See it for yourself
Pick your community and start exploring. Free, no credit card.